
Results
Total carbon and nitrogen in sediment
Carbon values ranged from 1.58 g/100g dry weight (V44) to 21.1 g/100g dry weight (V12) in the sediment samples of Varthur Lake. Higher C values were in the samples of northwest and northeast shoreline side of the lake (Fig. 3) at a depth of 0.25 to 1 m and lower concentrations were found in the middle and outlet regions. Nitrogen values as indicated in Fig. 4, ranged from 0.05 g/100g dry weight (V27) to 1.37 g/100g dry weight (V12) and the spatial variations of N concentrations are similar to carbon. C: N ratio ranging from 4.26 (V44) to 56.38 (V27) corroborate that organic matter is of terrestrial sources. It was observed that the middle regions of the lake had a higher C: N value than the other regions.
Total carbon and nitrogen in macrophyte samples
Carbon and nitrogen content (range and mean) in shoot and root of macrophyte samples are given in table 2. Carbon content in studied macrophyte samples ranged from 29.74 g/100g dry weight to 38.5 g/100g dry weight. Eichhornia crassipes and Alternanthera philoxeroides shoot had higher C content at sampling location V2 (inlet), while V15 (south shoreline) had lowest. Average C content in the shoots of Eichhornia crassipes is about 34.2 g/100g dry weight and Alternanthera philoxeroides is 34.6 g/100g dry weight. C content in roots of Eichhornia crassipes had higher values in V34 (north shoreline) and lowest in V3 (south shoreline). Carbon content in roots of Alternanthera philoxeroides was lowest at V2 and highest at V27. C values (shoot and root) of Colocasia esculenta and Typha angustifolia were higher at V12 (north shoreline) and lower at V45 (outlet) respectively.
The range of nitrogen in macrophyte samples was 1.2-5.27 g/100g dry weight. Nitrogen content in Eichhornia crassipes shoot was higher at south shoreline (V7: 4.3g) and lower at north shoreline (V12: 2.6g). The average value of N in Eichhornia crassipes shoot is 3.59 g/100g dry weight and 3.2 g/100g dry weight in roots. The highest N content in Eichhornia crassipes root was found at V27 and V3 had the lowest N content. Alternanthera philoxeroides shoot (4.8g) and root (3.8g) had highest and lowest nitrogen content at V2 and V27 respectively. In case of Colocasia esculenta and Typha angustifolia the N content (above ground and below ground parts) was highest at V12 and lowest at V45.
Table 2 Carbon (C) and nitrogen (N) content in sediment and macrophyte samples of Varthur Lake
Sample |
N (g/100g dry weight) |
C (g/100g dry weight) |
||
Range |
Mean |
Range |
Mean |
|
Sediment |
0.05-1.4 |
0.57 |
1.57-21.1 |
8.56 |
Eichhornia crassipes shoot |
2.57-4.34 |
3.59 |
33.87-37.51 |
34.84 |
Eichhornia crassipes root |
2.84-4.32 |
3.2 |
29.74-35.97 |
33.65 |
Alternanthera philoxeroides shoot |
4.12-5.27 |
4.85 |
33.98-35.78 |
34.61 |
Alternanthera philoxeroides root |
3.16-4.43 |
3.80 |
35.29-37.2 |
36.25 |
Typha angustifolia shoot |
1.2-3.5 |
1.99 |
30.1-32.2 |
31.14 |
Typha angustifolia root |
2.1-4.25 |
2.92 |
32.6-35.5 |
34.69 |
Colocasia esculenta shoot |
4-4.46 |
4.26 |
36.5-38.5 |
37.51 |
Colocasia esculenta root |
3.75-4 |
3.88 |
38.08-38.41 |
38.25 |
Heavy metal concentration in sediment
Table 3 lists heavy metal concentrations in sediment samples. The mean concentration of all metals in sediments were above threshold effect level (TEL) and was in the order Cu>Zn>Cr>Ni>Pb>Cd. Cadmium content in sediments were above TEL and Probable effect level (PEL) with V12 and V36 (middle) having highest and lowest (Fig. 5). Chromium concentration was lowest in middle (V37) and highest at northwest shoreline (V21) (Fig. 6). Copper concentration in sediment samples were in the range 86.5-421.6 mg/kg, which are above critical ranges. The inlet and shoreline regions had higher accumulation of copper (highest at northwest shoreline) while lowest concentrations were in middle regions (Fig. 7). Samples from the middle region (V36) had lowest concentration and northwest shoreline sample (V12) had the highest concentration of lead (Fig. 8). Nickel concentration in sediment samples is in the range of 26.7-80 mg/kg with mean value of 54.76 mg/kg (Table 3, Fig. 9) and all samples are within critical level and PEL. Highest nickel concentration in sediment samples was recorded at northwest shoreline (V12) and lowest in the samples of inlet and middle (Fig. 9). Zinc in the sediment samples ranges from 26.8-352.9 mg/kg (Table 3, Fig. 10) with an average value of 131.65 mg/kg., which are little higher than the earlier reports [43] and is within the critical range in all the samples. Highest zinc concentration was in the sample at northwest shoreline (V12) and lowest in near inlet sample (V5) (Fig. 10).
Heavy metal concentration in macrophytes
Tables 4 and 5 provide heavy metal concentrations in macrophytes samples, which highlight the relative concentrations were Cu>Zn> Cr> Pb>Ni>Cd in macrophytes. Cadmium concentration in macrophytes samples were higher in Typha angustifolia root and lower in Eichhornia crassipes shoot. The order of accumulation in macrophytes was Typha angustifolia > Eichhornia crassipes > Alternanthera philoxeroides > Colocasia esculenta (Table 5). Chromium in macrophytes was in the range of 34-54.8 mg/kg (mean- 42.33 mg/kg) (Table 4) with lowest in Typha angustifolia root and higher in Eichhornia crassipes shoot (Table 5). Colocasia esculenta had highest concentration followed by Eichhornia crassipes, Alternanthera philoxeroides and Typha angustifolia (Table 5). Chromium content in all macrophyte samples exceeded critical limits. The concentration of copper was maximum in Alternanthera philoxeroides shoot and minimum in Eichhornia crassipes shoot (Table 5). Lead concentration ranges from 8.7-56.7 mg/kg with mean value of 21.9 mg/kg with concentrations in Alternanthera philoxeroides> Eichhornia crassipes> Typha angustifolia> Colocasia esculenta (Table 5). Colocasia esculenta root had lowest concentration and Alternanthera philoxeroides shoot had highest concentration of lead. Alternnathera philoxeroides and Eichhornia crassipes had lead concentrations in critical range. Nickel content was lowest in Colocasia esculenta and highest in Typha angustifolia root and was exceeding the critical range of 5 mg/kg in most of the samples. Concentrations of Nickel was higher in Typha angustifolia > Eichhornia crassipes > Alternanthera philoxeroides > Colocasia esculenta (Table 5). Zinc in macrophyte samples were within normal and critical range [62]. Alternanthera philoxeroides shoot had the highest concentration and Eichhornia crassipes shoot had the lowest concentration of Zinc. Overall Alternanthera philoxeroides was higher accumulator of Zinc followed by Eichhornia crassipes, Typha angustifolia and Colocasia esculenta (Table 5).
Table 3 Mean, range and critical concentration of heavy metal (mg/kg) in sediments of Varthur Lake
Metal |
Mean (Range) (mg/kg) |
CPCBa (2001) |
TELb [74] |
PELc [74] |
Critical soil concentration [62] |
Uncontaminated sediments [51] |
Cd |
5.82 (1.4-23.7) |
BDL |
0.596 |
3.53 |
3-8 |
- |
Cr |
101.92 (36.5-161.7) |
389.3 |
37.3 |
90 |
75-100 |
12-44 |
Cu |
210.57 (86.5-421.6) |
113 |
35.7 |
197 |
60-125 |
- |
Ni |
54.76 (26.7-80) |
54.5 |
35 |
91.3 |
100 |
1-20 |
Pb |
45.26 (23.4-59.9) |
64.9 |
18 |
36 |
100-400 |
2-50 |
Zn |
131.65 (26.8-352.9) |
- |
123 |
315 |
70-400 |
1-50 |
aCPCB: Central Pollution Control Board; bTEL: Threshold effect level; cPEL: Probable effect level
Table 4 Comparison of heavy metal (mg/kg) in macrophytes of Varthur Lake with critical and normal range in plants
Metal |
Mean (Range) (mg/kg) |
WHOa standard |
Critical range in plants [62] |
Normal range in plants [62] |
Cd |
0.21 (0-0.8) |
0.5 |
5-30 |
0.1-2.4 |
Cr |
42.33 (34-54.8) |
1.3 |
5-30 |
0.03-14 |
Cu |
66.81 (21.3-263.5) |
40 |
5-30 |
1-5 |
Ni |
8.44 (3.5-17.1) |
10 |
10-100 |
0.02-5 |
Pb |
21.9 (8.7-56.7) |
2.0 |
30-300 |
0.2-20 |
Zn |
64.76 (14.8-155.5) |
60 |
100-400 |
1-400 |
aWorld Health Organization
Table 5 Heavy metal concentration in macrophytes (mean ± SD) of Varthur Lake
Metal |
Plant |
Shoot |
Root |
Cd |
Eichhornia crassipes |
0.10±.05 |
0.17±0.15 |
Alternanthera philoxeroides |
0.15±0.08 |
0.1±0 |
|
Colocasia esculenta |
0.1±0.04 |
0.1±0.02 |
|
Typha angustifolia |
0.2±0.07 |
0.7±0.06 |
|
Cr |
Eichhornia crassipes |
44.7±5.99 |
42.37±3.85 |
Alternanthera philoxeroides |
45.03±3.43 |
37.85±5.44 |
|
Colocasia esculenta |
38.1±3.23 |
50.8±3.56 |
|
Typha angustifolia |
43.8±3.59 |
33±3.21 |
|
Cu |
Eichhornia crassipes |
58.46±31.05 |
89.43±12.48 |
Alternanthera philoxeroides |
148.18±109.07 |
103.05±10.25 |
|
Colocasia esculenta |
28.9±3.89 |
44.4±5.66 |
|
Typha angustifolia |
42.1±6.23 |
32.1±2.13 |
|
Ni |
Eichhornia crassipes |
6.18±2.57 |
12.57±0.65 |
Alternanthera philoxeroides |
5.57±0.71 |
7.85±2.19 |
|
Colocasia esculenta |
5.6±1.62 |
4.95±1.11 |
|
Typha angustifolia |
7.7±2.26 |
16.2±0.56 |
|
Pb |
Eichhornia crassipes |
22.7±5.18 |
24.8±2.39 |
Alternanthera philoxeroides |
32.42±18.65 |
33.2±18.95 |
|
Colocasia esculenta |
13.5±2.87 |
9.25±0.25 |
|
Typha angustifolia |
20.5±5.65 |
18.8±6.22 |
|
Zn |
Eichhornia crassipes |
38.78±39.16 |
121.67±6.85 |
Alternanthera philoxeroides |
28.6±6.54 |
139.45±22.7 |
|
Colocasia esculenta |
20.6±2.96 |
28.85±4.74 |
|
Typha angustifolia |
23.1±3.96 |
117±5.87 |
 Fig. 5 Concentration of cadmium in sediment samples |
 Fig. 6 Concentration of chromium in sediment samples |
 Fig. 7 Concentration of copper in sediment sample |
 Fig. 8 Concentration of lead in sediment samples of Varthur Lake |
 Fig. 9 Concentration of nickel in sediment samples of Varthur Lake |
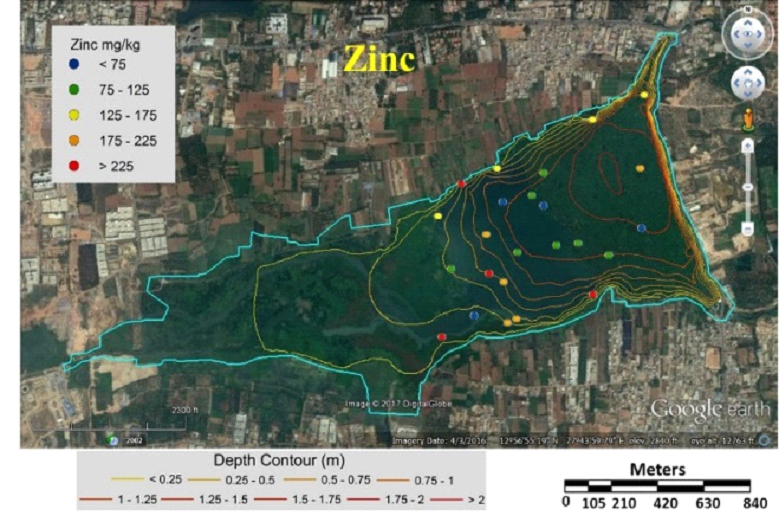 Fig. 10 Concentration of zinc in sediment samples of Varthur Lake |
Bio-concentration and Translocation factor
Bio-concentration factor (BCF) and translocation factor (TF) were used for understanding the heavy metal distribution pattern in macrophytes of Varthur Lake (Fig. 11 and 12). Bio-concentration factors for Pb, Zn, Ni, Cr, Cd and Cu ranged from 0.5 to 1.45, 0.38 to 1.28, 0.19 to 0.28, 0.75 to 0.9, 0.13 to 0.27, 0.35 to 1.14 respectively (Fig. 11) with Zn > Pb > Cr > Cu > Ni > Cd. Higher BCF for lead, zinc and copper was in Alternanthera philoxeroides, while higher BCF for nickel and cadmium in Typha angustifolia and for Chromium in Colocasia esculenta. The translocation factor for Pb, Zn, Ni, Cr, Cd and Cu ranged from 0.9 to 1.45, 0.22 to 0.71, 0.45 to 1.13, 0.7 to 1.32, 0.25 to 1.5 and 0.65 to 1.43 respectively (Fig.12) and the translocation factor of Pb > Cr > Cu > Cd > Ni > Zn. Among the studied macrophytes, Colocasia esculenta had higher TF for lead, zinc and nickel. Alternanthera philoxeroides had maximum TF for cadmium and copper and while Typha angustifolia had maximum TF for chromium.
 Fig. 11 Bio concentration factor (BCF) of macrophyte samples |
 Fig. 12 Translocation factor (TF) of macrophyte samples |
Discussion
Total carbon and nitrogen in sediment and macrophytes
Nutrients such as carbon and nitrogen play a vital role in maintaining trophic levels in lake ecosystems. Assessment of organic matter concentrations helps in understanding the nutrient dynamics in a lake ecosystem. The organic matter in sediments is given by the ratio of total organic carbon to total nitrogen (C/N ratio), which aids in estimating the percentage of autochthonous planktonic matter in sediments [63] and C/N ratios in lake sediments reflect the composition of organic matter [64, 65]. Increase in cellulose content increases C/N ratio. C/N ratios of 5 to 6 in phytoplankton and zooplankton are due to proteins consisting primarily of nitrogen compounds. The C/N ratio in the terrestrial vascular plants is 15 or > 20 [66] and in the case of macrophytes C/N ratio is about 39.4. Variations in C: N ratios within lake sediments helps in determining the historical changes in the sources of organic matter. Increases in C: N ratio in sediment profiles have been useful to interpret the period (in a lake’s history) when sediments received a high proportion of terrestrial organic matter [67].
Higher C values in sediment were in the northwest and northeast shoreline side of the lake, attributed to higher terrestrial C sources of domestic sewage from the urbanized pockets of the catchment. Lower C values in the lake sediments were observed at southern side and outlets of the lake, where depth is greater than 1 m. Similar C and N distributions were reported in the earlier studies [65]. Higher C:N in middle regions is due to the sustained inflow from the neighboring residential layouts on both sides and the middle regions are with stagnant water. This highlights the storm water drains are being misused with the discharge of sewage, contributing terrestrial organic matter into the lake.
Macrophyte sample analyses revealed that higher concentration of carbon was in Colocasia esculenta root and lowest in Eichhornia crassipes root, and these values were lesser compared to earlier study [40]. Emergent macrophytes had higher carbon concentration than floating plants because of fibers in developed support system [14]. Nitrogen was higher in Alternanthera philoxeroides shoot and lowest in Typha angustifolia shoot. The results of this study showed higher nitrogen content than earlier report [40].
Heavy metal concentration in sediment and macrophytes
Tables 6 and 7 compares metal concentrations in sediment and macrophytes of Varthur lake with various other studies. Cadmium is of most concern due to the greatest mobility in soil environment [68] and is widespread heavy metal, which is extremely toxic to humans and plants [69]. Cadmium enters aquatic environment through anthropogenic sources like industrial effluent and agricultural runoff [70]. Cadmium concentration in this study was higher compared to the earlier study [43], and above PEL and critical range [62, 74]. The highest concentration (23.7 mg/kg) was observed in the northwest shoreline sample (V12) and the lowest (1.4 mg/kg) in the middle sample (V36) (Fig. 5). These values were lower compared to the samples of Bellandur Lake [2]. The outlet and middle region had lower concentration of cadmium compared to other regions (Fig. 5). Chromium is toxic for plants as it alters N metabolism and impairs protein formation [27]. More than half of the sampling points had critical ranges of chromium. Sediments in the inlet and north shoreline regions had higher concentrations of chromium than other samples (Fig. 6). Present study values were 10 times higher than the earlier reports [43]. Copper concentrations in the current study were higher compared to the earlier study [43] and lower compared to Bellandur Lake [2]. Lead is one of the most toxic metal at low concentrations and non-essential element for plant [71, 27]. The main source of lead in the sediment is from lead pipes, mixing of gun powder, waste batteries, etc. [72]. Earlier studies [43, 2] recorded lower lead concentrations compared to present study. Zinc in the sediment samples were little higher than the earlier reports [43]. Plant growth, metabolism and physiology is effected by toxic metal nickel. The concentration of nickel in sediments were lower than PEL and critical values.
The Varthur lake catchment also receives surface runoff containing fertilizers and pesticides from agriculture and floriculture lands, which is contributing to Cd, Pb, Ni in the lake surface sediments. Untreated wastewater from industries such as electroplating, metallurgical, batteries manufacturing, vehicle garages, etc. has contributed to the accumulation of heavy metals (Cr, Cu. Cd and Zn), which is evident from the analysis of sediment samples at the north shoreline. Among macrophyte samples, Alternanthera philoxeroides and Eichhornia crassipes had higher concentration of all investigated heavy metals.
Plants with high BCF and low TF (BCF > 1 and TF < 1) aid in efficient remediation with phytostabilization, while phytoextraction happens with both BCF and TF > 1 [73]. In the current study, scope for remediation of heavy metals (lead and zinc) through phytostabilization was exhibited by Alternanthera philoxeroides and Eichhornia crassipes respectively. Alternanthera philoxeroides showed phytoextraction capability of copper. Colocasia esculenta, Typha angustifolia and Alternanthera philoxeroides displayed higher mobility for nickel, chromium and cadmium respectively (BCF<1 and TF>1).
Table 6 Comparison of heavy metal (mg/kg) in sediments of current study with other studies
Name of the Lake |
Metal concentration (mg/kg) |
References |
|||||
Cd |
Cr |
Cu |
Ni |
Pb |
Zn |
||
Varthur Lake, Bangalore |
5.8 (1.40-23.7) |
102 (36.5-162) |
211 (86.5-422) |
54.8 (26.7-80.0) |
45.3 (23.4-59.9) |
132 (26.8-353) |
Present study |
Varthur Lake, Bangalore |
BDL -17.3 |
BDL -21.4 |
131-134 |
16.2-68.0 |
4.40-88.5 |
25.7-220 |
[43] |
Bellandur Lake, Bangalore |
1.60-55.3 |
33.9-199 |
105-1148 |
15.1-138 |
31.2-208 |
126-2001 |
[2] |
Wular Lake |
- |
160.27 |
47.33 |
57 |
- |
- |
[76] |
Ramgarh Lake |
0.015 |
- |
1.33 |
- |
0.27 |
2.28 |
[77] |
Veeranam Lake, Chennai |
0.20-3.90 |
40.0-150 |
65.0-125 |
34.0-95.0 |
20.0-41.0 |
65.0-599 |
[78] |
ICRISAT Lake, Patancheru |
0-0.1 |
16.6-75.4 |
6.1-40.3 |
6.7-41.5 |
4.2-19.6 |
3.8-55.2 |
[79] |
Anchar Lake Kashmir |
0.70-3.60 |
3.10-8.70 |
2.80-28.7 |
2.10-10.1 |
0.40-4.30 |
1.40-13.8 |
[80] |
Yercaud Lake |
- |
322-441 |
480-687 |
147 |
15.5-48.0 |
101-258 |
[81] |
Akkulam Veli Lake, Thiruvananthpuram |
- |
49.0-642 |
1.00-126 |
5.00-259 |
18.0-189 |
19.0-279 |
[82] |
GB Pant Sagar |
0.30-5.60 |
0.60-32.3 |
1.30-30.7 |
0.30-38.3 |
1.00-11.0 |
5.00-59.9 |
[83] |
Kolkata Wetlands |
- |
12-57 |
17-145 |
19-37 |
13-118 |
80-425 |
[84] |
Kodaikanal Lake |
- |
452 |
54.5 |
115 |
44.7 |
113 |
[85] |
Urban Pond, Dhanbad |
1.70-5.00 |
74.0-109 |
- |
- |
23.3-36.0 |
1055-1804 |
[86] |
Table 7 Comparison of heavy metal (mg/kg) in macrophytes of current study with other studies
Macrophyte |
Metal concentration (mg/kg) |
References |
|||||
Cd |
Cr |
Cu |
Ni |
Pb |
Zn |
||
Eichhornia crassipes |
0.17±0.15 |
42.37±3.9 |
89.43±12.5 |
This study |
|||
8 (0.72-21.5) |
71.5 (1.2-160.9) |
9.63 (BDL-21.0) |
47.9 (26-65.3) |
63.4 (22-98.5) |
42.9 (27.4-58.3) |
[43] |
|
1500±47 |
309±13.1 |
560±15 |
260±8.1 |
267±9.0 |
1400±74.3 |
[87] |
|
9.13±0.15 |
8.06±0.93 |
92.4±0.3 |
- |
83.42±0.7 |
572.8±2.3 |
[88] |
|
61.5 |
- |
- |
- |
356.2 |
- |
[89] |
|
0.82 |
0.32 |
0.14 |
0.15 |
6.29 |
- |
[90] |
|
8.7 |
33.1 |
25.3 |
1077 |
40 |
243 |
[91] |
|
- |
- |
62.5±17.5 |
12.9±8.4 |
25.2±1.2 |
238.1±76.4 |
[92] |
|
8.3-30.9 |
6.2-133.8 |
- |
- |
34.9-80.9 |
- |
[75] |
|
21.8 |
- |
2868 |
253 |
- |
- |
[94] |
|
128 |
69.3 |
- |
78.5 |
256 |
- |
[95] |
|
0.79 |
- |
44.5 |
28.83 |
9.81 |
709.1 |
[96] |
|
- |
- |
- |
- |
13.89 |
140.97 |
[99] |
|
- |
160±12.0 |
23.2±1.7 |
- |
11.5±1.8 |
170±40.6 |
[100] |
|
Alternanthera philoxeroides |
0.15±0.08 |
45.03±3.43 |
148.2±109.1 |
7.85±2.19 |
33.2±18.95 |
139.5±22.7 |
This study |
8.5-45.1 |
0.3-81.3 |
- |
- |
46.6-91.8 |
- |
[75] |
|
16.4 |
- |
2839 |
441 |
- |
- |
[94] |
|
- |
- |
- |
- |
53.3-383.3 |
54-199.5 |
[98] |
|
Colocasia esculenta |
0.1±0.04 |
50.8±3.56 |
44.4±5.66 |
5.6±1.62 |
13.5±2.87 |
28.85±4.74 |
This study |
4.16±1.98 |
- |
28.6±8.8 |
- |
25.5±11.6 |
- |
[93] |
|
3.2 |
1545 |
- |
43.6 |
148.5 |
- |
[95] |
|
2.3±0.5 |
11.9±1.0 |
80.7±5.8 |
- |
- |
- |
[97] |
|
- |
- |
- |
- |
27.94±0.45 |
105.3±0.09 |
[99] |
|
Typha angustifolia |
0.7±0.06 |
43.8±3.59 |
42.1±6.23 |
16.2±0.56 |
20.5±5.65 |
117±5.87 |
This study |
9.5 |
14.5 |
43.2 |
370 |
32.66 |
216 |
[91] |
|
- |
- |
8.98±1.7 |
9.95±2.9 |
29.5±3.4 |
97.6±5.2 |
[92] |
|
1.44 |
- |
104.21 |
20.26 |
6.92 |
276.13 |
[96] |
|
The study highlights the presence of organic and heavy metals in sediments and macrophytes, indicating contamination due to the sustained inflow of untreated sewage and industrial effluents. Environmental changes in the lake catchment during the past five decades due to rapid urbanization have been responsible for the lake contamination. The organic contamination is mainly due to untreated sewage and runoff entering the lake. The metal pollution is due to entry of industrial wastewater and agricultural runoff. The study recommends proper treatment of sewage before letting into the lake to prevent contamination and associated health hazards in the vicinity.